ARK buys $20.2M of Meta Platforms Inc after a 12% slide
ARKF and ARKK added on weakness rather than waiting for a bounce. Plus the other trades that day and how ARK compares with the market.
Generated from ARK's own holdings data.
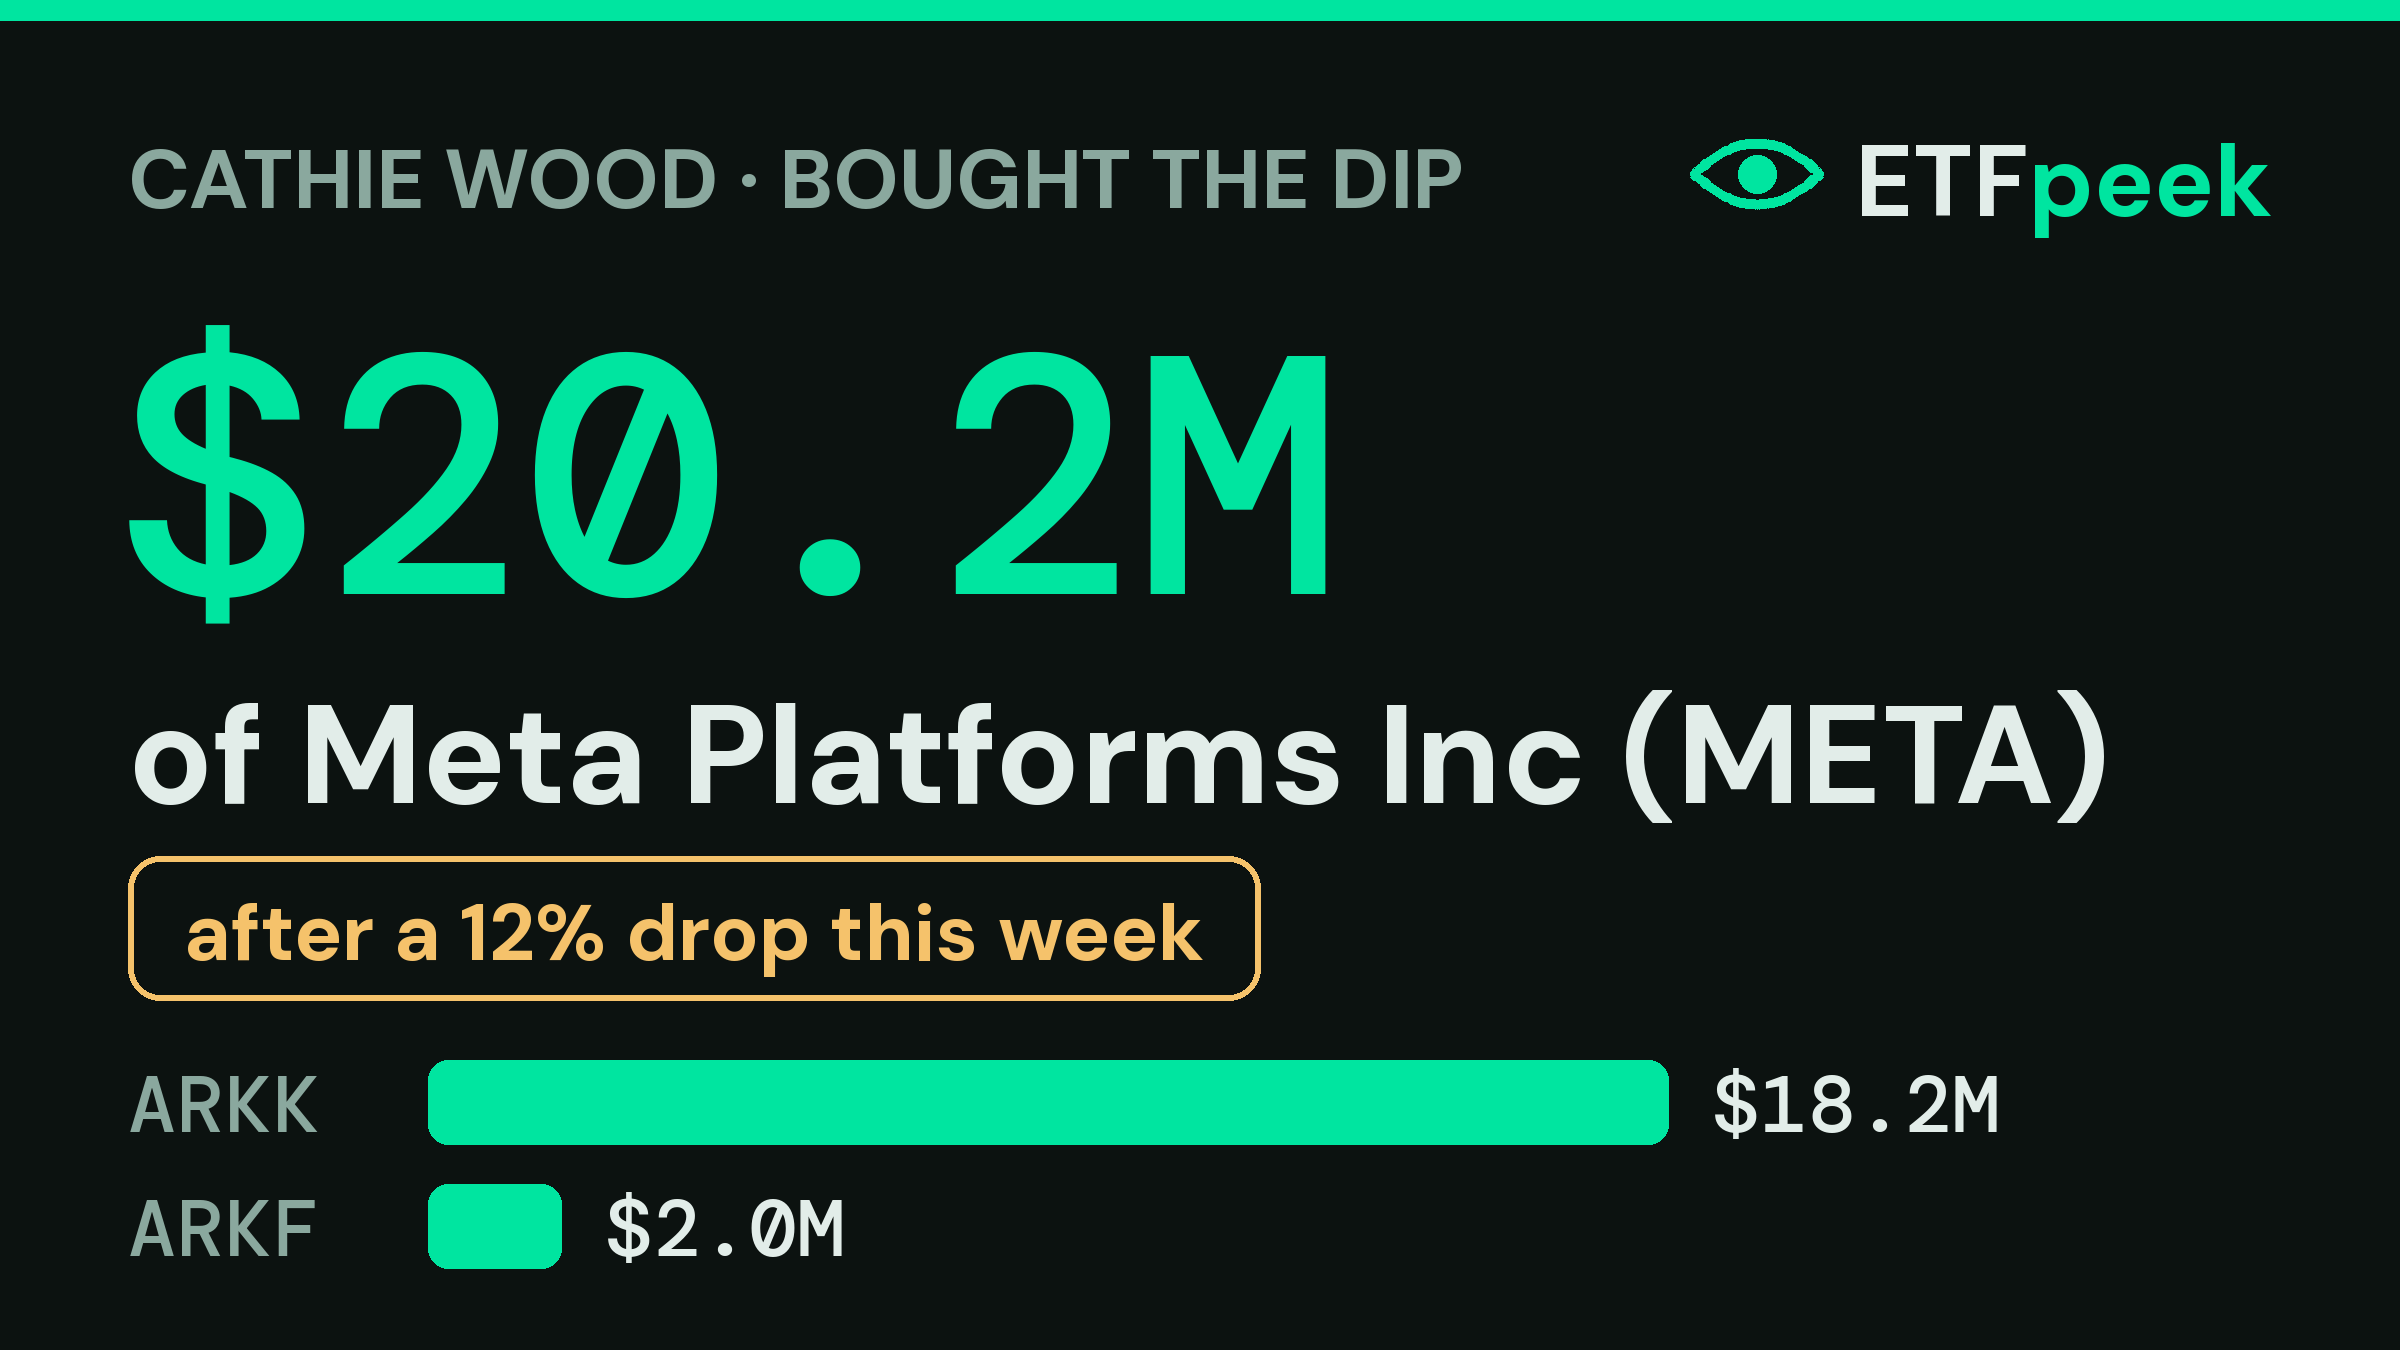
ARK bought roughly $20.2M of Meta Platforms Inc (META) on 23 Oct 2026, spread across ARKF and ARKK. The stock had fallen 12% over the previous week when ARK stepped in.
Strip out the 0.4% that every holding moved as money left the funds, and META still grew 15%. That excess is what we count as a trade.
Over the last 30 days ARK has been a net buyer of Meta Platforms Inc — $7.1M across 6 trades.
Everything ARK did on 23 Oct 2026
ARK made 7 real moves that day, once money flowing in and out of the funds is stripped out:
| Stock | Funds | Est. value |
|---|---|---|
| META Meta Platforms IncBought after a 12% drop this week | ARKF and ARKK | +$20.2M |
| TER Teradyne IncSold 3 days running | ARKK | −$17.7M |
| SCTX Scribe Therapeutics IncBought 5 days running | ARKG | +$1.8M |
| PLTR Palantir Technologies Inc | ARKF | −$1.6M |
| PACB Pacific Biosciences Of CalifBought 3 days running | ARKG and ARKK | +$731K |
| FRNM Freenome Inc | ARKG | +$463K |
The bigger picture: ARK's last 30 days
The 30-day picture: Nvidia Corp ($81.0M), CoreWeave Inc ($74.9M), Veracyte Inc ($39.9M) have taken the most new money. On the other side, it has been cutting Advanced Micro Devices ($126.3M), Personalis Inc ($92.6M), 10X Genomics Inc ($69.6M).
Is it working?
This year ARKK is behind the market — +6.4% against +12.9% for the S&P 500.
The last month has been rough: ARKK is -10.6% against -1.2% for the S&P 500. The biggest drags were Tempus AI Inc (-17%, 6% of the fund), Robinhood Markets Inc (-22%, 4% of the fund), Coinbase Global Inc (-16%, 5% of the fund).
The last 12 months tell a different story — ARKK -4.1% versus the index's +15.6%, a 20-point gap.
That five-year gap — 110 points — mostly comes down to timing. Five years ago ARKK was trading close to its all-time high of Feb 2021. It then fell 81% to its low in Dec 2022, and it is still 47% below that peak today. Any comparison that starts near the top of that boom looks brutal.
| To date | 1 month | YTD | 1 year | 5 years |
|---|---|---|---|---|
| ARKK | -10.6% | +6.4% | -4.1% | -29.3% |
| S&P 500 (SPY) | -1.2% | +12.9% | +15.6% | +80.3% |
| Nasdaq-100 (QQQ) | -5.8% | +14.9% | +16.8% | +93.8% |
How we work this out
ETFpeek is an independent research tool and is not affiliated with ARK Invest or Cathie Wood. Figures are estimates from public fund data, shown for information only — not financial advice. Past performance does not indicate future results.